Several time when you manage a project with lots of deliverables and priorities, you will have less critical activities that will get postponed again and again. That could be due to new unforeseen high priority actives with not enough resource available to do everything.
But at some point a planed activity is meant to be done, and delaying again and again an activity (as “low priority” it is) could lead to several impacts: slip of other activities due to dependencies, budget not spent on this activity may not be available later, loss of confidence in the schedule from impacted stakeholders, loss of overall performance.
The first thing to do in this case is to identify that the deliverable is no longer under control so they should build up a proper plan in order to be consistent in their forecasts. One could use the “Note” section of the deliverable to archive every changes, and see for how long it has been alive and how many times it has been rescheduled, but this is manual and have to be done thoroughly since the deliverable creation. Moreover, it would be more visual and impacting to use a KPI instead.
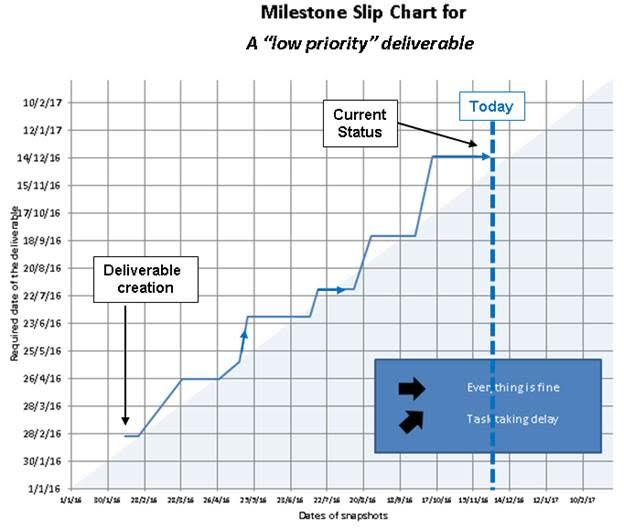
Since most management system will provide snapshots of deliverable status, we can use this data to find how the deliverable has evolved since its creation: this is the time diagram, or slip diagram.
The KPI will show on:
- the x axis a timeline to place the different snapshots
- the y axis all the required dates
You can build such chart using Excel (VBA is not necessary), with one snapshot per worksheet. From the list of snapshot dates, the main formulas to be used will then be “Indirect” to choose the proper worksheet dynamically, and a “Vlookup” to find the right deliverable name and retrieve the required date. With a simple drop-down list, the user select the deliverable he wants to view, and the chart will update dynamically.
You read the diagram from the bottom left to the top right:
- If the line is horizontal, everything behaves “as planned”.
- If the line goes up, then there is a slip.
- You can easily view and count how many times a deliverable has slipped.
- You can see if a deliverable was late or not (when it enters the blue area)
Once you proved to your supported manager that a deliverable is out of control, the next step is to launch a recoverable action. From the PMP, this could be considered as a risk, with 4 main choices to deal with the issue:
- Mitigate (create a recovery plan and affect resources to assess the issue)
- Avoid (eliminate the threat (delete the deliverable i.e. the activity will not be done) or protect the project from its impact)
- Transfer (give the scope to another third party able to deal with it)
- Accept (acknowledge and accept the impact on the schedule, and budget)
Feel free to contact me if you want more information.